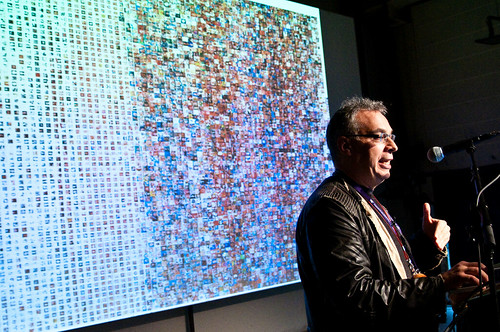
New media theorist Lev Manovich summarized his latest contribution to the field of software studies: cultural analytics. The idea of cultural analytics was first presented by Lev Manovich in 2005, and in 2007 he released a paper at CALIT2 entitled “Cultural Analytics: Analysis and Visualization of Large Cultural Data Sets.” In his talk today Manovich routinely made comparisons between cultural analytics and cultural analysis, and so it was necessary that audience members understand the distinction between these two (similarly sounding) terms: whereas traditional cultural analysis relies on real-world resources (human interpretation and physical storage), cultural analytics relies on the computer and search algorithms in order to discern and interpret culture.
Within cultural analytics Manovich is looking to answer questions such as: Can we create quantitative measures of cultural innovation? Can we visualize flows of cultural ideas, images, and trends? As a new way to study culture he suggested, “Let’s take principles from search engines (and data analysis in general) + web analytics and Google Trends (interactive visualization of patterns) + Google Earth (continuous zoom and navigation) + Manyeyes (visualization, sharing of data and analysis).”
Manovich’s work is perhaps more easily understood through examples that implement these techniques. He presented the “Interactive Visualization of Image Collections for Humanities Research” project which was developed by Manovich and the Software Studies Institute at UC San Diego. The project explores a collection of Mark Rothko’s paintings: turning the paintings into sets of data that can be graphed, and then turning that data into a collection of paintings (see the video below). Manovich argued, “by extracting and graphing this data it will help us understand patterns and explore trends in a painter’s life and work.”
[youtube]http://www.youtube.com/watch?v=-YlT1qFhJhk&feature=player_embedded#[/youtube]
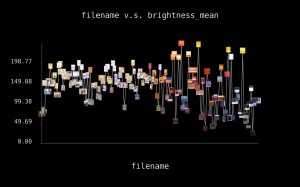
This visualization shows changes in Rothko’s painting’s average brightness over his career.
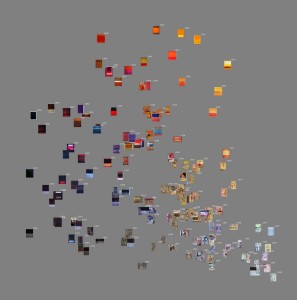
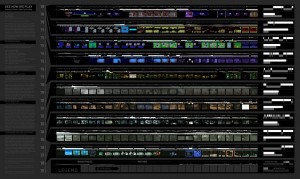
This visualization organizes the paintings by their brightness and saturation:
Manovich spoke in Amsterdam last May at the Paradiso to which his presentation on cultural analytics raised a great deal criticism [1] [2]. Shortly after his last talk professor and art historian Edward Shanken wrote the following on The University of Amsterdam blog,
“The outcome of the analysis was as underwhelming as the method was problematic. The challenges of accurately capturing the color and tone of a painting in digital form and then representing them on a monitor are well known. The challenges of comparing multiple paintings on monitors is all the more complicated. While there may be insights to be gained by such a method – and I’m not sure how relevant they would be even in the best of circumstances – it appears to be limited to only the most superficial formal aspects of a painting. And while certain aspects of connoisseurship may be aided by computer analysis of high-resolution digital images, Manovich’s example was far from that. What do we learn about Rothko or about art in general from an analysis of the brightness in his work over time? Why even bother posing that as a research question?”
This morning Shanken politely asked Manovich,
Your work enables us to ask questions we might have not seen before, but could you tell us more about the particlar insights that this type of data has shown?
Manovich answered,
Every time I make visualizations I see something I have not seen before. The most common ideas about culture get challenged.
He went on to display the following graphic entitled “Seeing How We Play” and commented, “This visualization compares interactivity in ten video games over two decades. It shows very clearly what the relation is per game is: interactive vs. non-interactive times, and patterns of rapid changes.”
Richard Rogers, Director of the University of Amsterdam’s Digital Methods Initiative, poignantly followed up,
Have you been Googlized? A lot of critics say Google has taken over industry, over industry. E.g. libraries. Is Google now taking over humanities?
To which Manovich replied,
Good question. It’s not only Google, it’s general ideas and methods. We re-use and apply them for cultural analytics. At the same time we want to understand the methods so we can critique them better.
Later in the day at the Googlization panel Siva Vaidhyanathan asked Manovich a question that many of us were probably wondering,
Isn’t what you do expensive? It’s more than I’ve seen in any humanities lab…EVER!.
Of course the question was in reference to the 287-Megapixel HIPerSpace Wall seen early in Manovich’s presentation, but either Manovich didn’t completely understand or was trying to avert the question with his short reply,
I do most of my work with my laptop using open-source software.
Whether you agree or disagree with his cultural analytics research, Manovich’s allure is that his ideas are often compelling and provocative. He recently released a digital copy of his upcoming book “Software Takes Command” on his website where more information about Lev Manovich and the Software Studies Institute is also available.