Panel 2: Sociometry, Networks and Classification
In a brief introduction, Konrad Becker mentions that the first speaker of this panel, Greg Elmer, is unable to make it to the conference. He is happy to welcome Sebastian Giessmann, as his focus on networking as a ‘technique of the social’ works well within the context of the historical vision of organizing the world’s information; not only things but also people. We can see this development in the rise of mass society when the need to classify social relations emerged. Interestingly, the roots of these social classification systems are often murky and obscure – criminology for instance, has a background in rather non-scientific and occultist themes. Sociometry finds its origin in a slightly more progressive idea.
 Sebastian Giessmann: From Sociometry to Social Networks. Networking as Technique of the Social. Sebastian Giessmann is a research fellow at the Excellence Cluster TOPOI in the cross-sectional group “Cultural Theory and its Genealogies” of the Humboldt-Universität zu Berlin.
As a cultural historian, Giesmann is professionally passionate for the occult. He specializes in the history of networks and networking, and intends to recount here the story of the ‘wild love affair’ between sociology and the visual form of the network diagram. His argument will frame both the history of knowledge and what William Mitchell has called ‘diagramatology’.
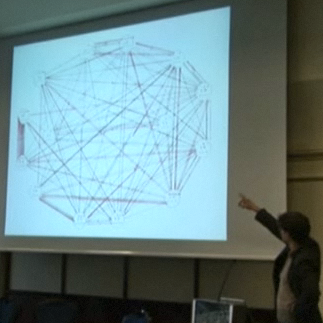
Net diagrams are systemic pictures, constantly reaching the boundaries of inscription spaces. They become network diagrams only if their nodes represent heterogeneous entities. Once a net consists of hybrid agents, interconnectivity and heterarchy become the standard, instead of ‘mere’ connectivity. But it is near impossible to draw the extendibility, aggregation and disillusion of networks in an iconic form – the classic conflict between time and space and media theory, and the reason why social images often resort to the dynamics of animation and simulation techniques. Grappling with the (im)possibilities of the topological, relational, visual form that has come to represent the network society is something Giesmann feels we must address critically and historically. Network diagrams offer only a measurement of sociality; out of the micro dimension of groups emerges the macro dimension of the network society.
Giessmann moves on to talk about the classics of sociology. Comte, Weber, Durkheim and Simmel rarely used graphics, but the 1930s introduced new methods with Jacob Levy Moreno’s psychological geography and Otto Neurath’s visual statistics, both as a way to deal with huge numerical datasets and to appeal to a wider audience. Moreno’s graphics imported the image practices of chemistry, making the ‘social atom’ the basic element for sociological visual augmentation.
Moreno’s work proved significant for the future of social networks. As head of a reeducation camp for young girls in Hudson, NY, he used the social relations between the girls and their different houses in much of his socio-geographical work. Giessmann presents a case study in which Moreno tries to grasp why so many girls run away from the camp. He concludes that the 14 runaways are part of a ‘hidden network’. Without the mapping, there was no network information to be found, network graphs work as a performative social matrix.
Networks represent the oldest forms of human communication. Participants are unaware of the networks they inhabit and cannot move out of these networks since they preexists them. Moreno’s surveillance regime was dubious, but his sociometrics precisely measured social exclusion and proved scalable; he later projected this method onto the entire New York population in order to measure isolation.
Social network analysis today is done by digital means. Relations are coded with 0 or 1, either there is a connection or there isn’t. The semantics of social network analysis changed a lot between the 19th and 20th century, shifting toward the micro-sociological approach. Moreno’s work is an early example of the new sociometric style in the making, the old rules proved increasingly insufficient to graph complex constellations of relational information. Looking for dynamic ways to visualize relations, 3D calculus models appeared in the 1950s and the first real time computer visualization, again based on the symbolic and iconic practices of chemists, appeared around 1980.
With the rise of software programs and java applets, graphs today easy to manipulate and the iconic form has become arbitrary. The diagram is a moving image, it represents while it computes, and vice versa. Giessmann quotes Benjamin who states that “we cannot draw closed the net in which we are caught”. On the contrary, the diagrammatic net strives for constant growth, which is one of the key features of networks.
In Web 2.0 social networking sites and their practices, the dispositions of sociometry and search in relational databases merge. Where do we stand, Giessmann asks. At the brink of even more advanced tools and global market research, like Facebook? A new social Web of recommendation, or utopian emotional transmission?
—
In the brief discussion after Giessmann’s talk, Elisabeth van Couvering raised a point as to the connection between mapping and search engines. A central aspect of search technology is the conceptualizing of the whole Internet as a graph of this type, with links representing connections in a particular direction. The way that search engines work in terms of understanding what’s likely to be relevant, and how you can even come up with an answer to that question is built exactly on this mapping technology. So, she says, let’s think of how this can be useful, perhaps not as a visualization, but certainly in the context of search and what we are talking about today.
////////
Panel Discussion (first round)
Chad Wellmon, Yuk Hui, Sebastian Giessmann, Konrad Becker (moderator)

Some interesting points emerging from the first plenary discussion of the day:
Kicking things off, Konrad Becker refers to the connection made in the first presentations between Google and enlightenment. The well-established notion of Google being ‘evil’ makes him wonder: Is enlightenment evil? Chad Wellmon responses by quoting Diderot, who argued that even if we had the perfect, infinite encyclopedia, one just like God’s mind, it would still be useless for us today. Despite its perfection and absoluteness, we are still a finite mind. This he feels is also true for Google; the Web in its entirety does not exist – and even if it did, we still have finite minds. So whether Google can read my mind or not, from a more phenomenological point of view, the question is irrelevant.
Another point is made by Wellmon in response to the question whether citations and linking are really analogous when looking at the fundamental difference in scale, and the active decision of placing a footnote versus the more emergent nature of linking. Wellmon replies that the ‘triumph of the citational logic’ is cashed out in terms of scale on one hand, but also in terms of absolute searchability. There are books in Google Books where every word becomes searchable. So in a sense – and you could do this with a journal article – every word, every character can become a footnote in the sense that it is linked. Every single element of a text is drawn into this logic.
Yuk Hui notes a great ignorance in the representation of the temporal experience of users. In interface design we often talk about experience, but it is based on the assumption that the user is a robot. In the case of Google, searching is something that actively engages in your thought process. You will get a result, which is something different than when you are looking for something yourself. Tagging is an active experience in which we try to understand objects. Hui feels that it is not the question whether any technology is evil; it is good and bad at the same time. For example; using network visualization to understand human mobility, or Google’s flu statistics, may help to understand something, but on the other hand it is dangerous. Heidegger speaks about the practice of presenting the world as an image so we can control, navigate and understand it. Peter Sloterdijk says ‘dasein is topological’ can we understand topological here as a network image? The answer for Hui is negative as the network image is ignorant of temporal experience.
Wellmon argues that there is a certain level of ‘necessary errancy’ in visualizations – or search engines for that matter – that we can recognize and reflect on. One could take a very practical imperative in that there is the condition of possibility of being able to use something. If a map weren’t scaled to use, that would be a worthless map. Konrad Becker refers to the famous theme of the 1:1 map and Korzybski’s quote ‘the map is not the territory’, or ‘the map portrays the map mapmaker’. More and more people say that the map actually is the territory, the map influences the territory or the map eats the territory. Maps are and have always been power tools – drawing a territory often led to ownership of it, and old maps on ships were embedded with lead so they would sink and its business intelligence would be lost to the enemy.