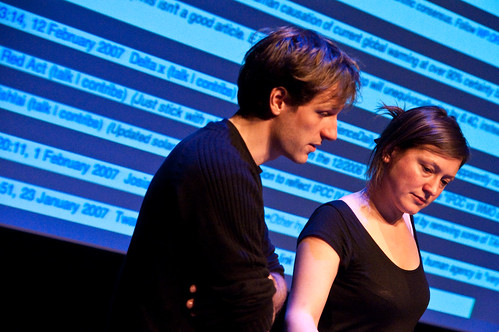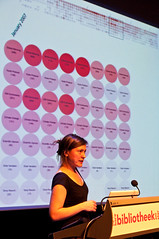
How does intense debate articulate on Wikipedia? How could we visualize the evolution of conflict on Wikipedia, does it have a pattern? These are more questions regarding the structure of Wikipedia wars were asked and answered by E. Weltevrede and E. Borra, as well as R. Rogers in absentia!. Weltevrede and Borra argued that the aims of the methodology explored is the detection of conflicts and the development of new metrics for the evaluation of the Wikipedia system.
The presenters focused on the climate change debate as a case study for understanding the evolution of controversy within the Wikipedia framework. The network of climate change debates was made after the thorough study of the number and timing of edits, the article length, the number of watchers, the number of discussion topics, the number of edits on these, the number of reverts and the bot activity, on climate change on Wikipedia. Using visualization software Weltevrede and Borra mapped out the climate change controversy network, that is the full quantity of articles on climates and how they link and relate to each other on Wikipedia, too inquire on if and how Wikipedia structures such network. Their findings were compelling: according to their analysis editorial activity is a definite indicator of heated debate as the dense parts of the map clearly indicated times were real controversy was caused due to the publication of more scientific data on climate change and so on.
They furthermore used network analysis software to discover role of the sub-issues in the developing of the wider network of issues. They asserted that editors shifting to related articles are an indicator of displacement. In other words when debate reaches a critical plato issues tend to fork. In fact forking and splitting, in general, are forms of controversy management within the Wikipedia structure. The central idea being that Wikipedia affect the debating of an issue in a certain way, and that it neutralizes opinion by splitting controversy into smaller interlinked parts.


