
On the 29th of November at Trouw we had the first day of “Screening the City”. It was an interesting day with the SpaceSee worksession and a film evening with Data on the Screen. The screenings provided an insight of different type of visualizations that are possible with the data we are generating and recording, or which recordings sometimes go unnoticed (information perceived by sensors, or by interacting in a website) and other times we gather on purpose, like checking in at Foursquare for example. From different perspectives and scales, this information that can also be impersonal like data traffic, or the 3,000 trash objects that MIT researchers traced after disposal, to very subjective like a father presenting a timeline of his son learning to say “water”.
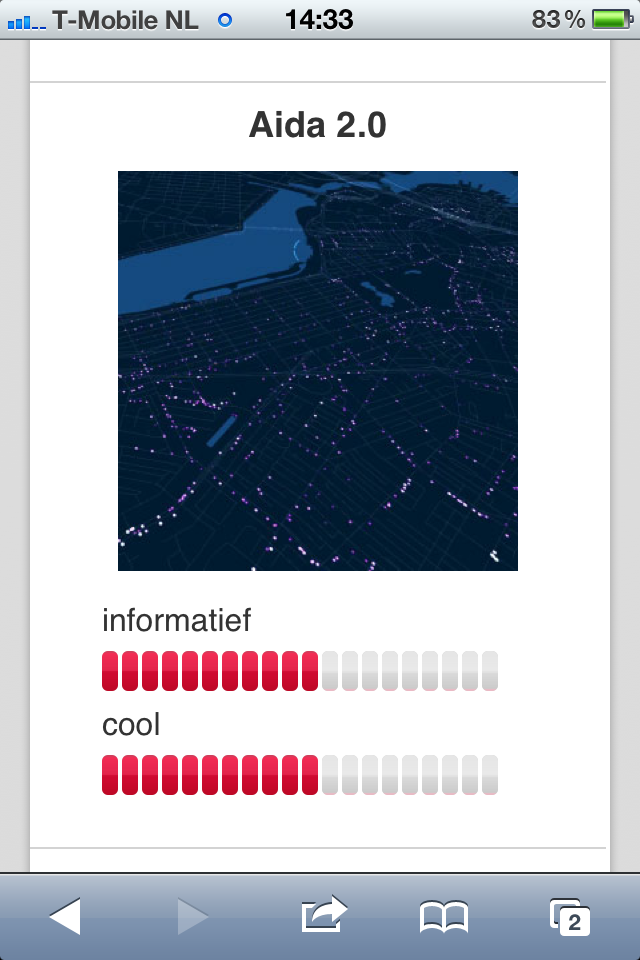
During the evening visitors could vote on their smartphone for the best data visualizations, through a special applet:
The audience could choose between ‘informative’ and ‘cool’. It turned out that the visualizations that gave more information were perceived as “cooler” by the audience.